0 Overview
This project is the power monitoring system of the substation in the east and west areas of the 07-2 plot of Hongqiao business district. According to the requirements of power distribution system management, it is necessary to monitor the incoming and outgoing circuits of the substations in the east and west areas of the 07-2 plot of Hongqiao business district to ensure the safety, reliability and efficiency of electricity consumption.
Acrel-2000 intelligent power distribution system makes full use of the latest development of modern electronic technology, computer technology, network technology and field bus technology to carry out decentralized data acquisition and centralized monitoring and management of power transformation and distribution system. The secondary equipment of the power distribution system is networked, and the field equipment of the distributed power distribution station is connected into an organic whole through the computer and communication network, so as to realize the remote monitoring and centralized management of the power grid operation.
1 System structure description
This monitoring system mainly realizes the power consumption monitoring and power management of the 10/0.4kV power distribution system of the 07-2 block of Hongqiao Business District; the monitoring range is the remote real-time monitoring and power management of the low-voltage incoming and outgoing line cabinets. The system has a total of 170 multi-function network power meters and 2 comprehensive protection, 2 temperature controllers and a DC panel in the east substation, a total of 12 buses; all the western substations have 172 multi-function network power meters and 6 comprehensive network power meters. There are 12 buses in total, including 4 temperature controllers and 1 DC screen. The substation instrument is directly pulled to the serial port server of the substation and then to the background computer to realize the data connection between the instrument and the monitoring host.
The monitoring system adopts a layered and distributed structure, that is, the station control layer, the communication layer and the interval layer;
As shown in Figure (1.1) (1.22):

Figure (1.1) East District Substation Network Topology
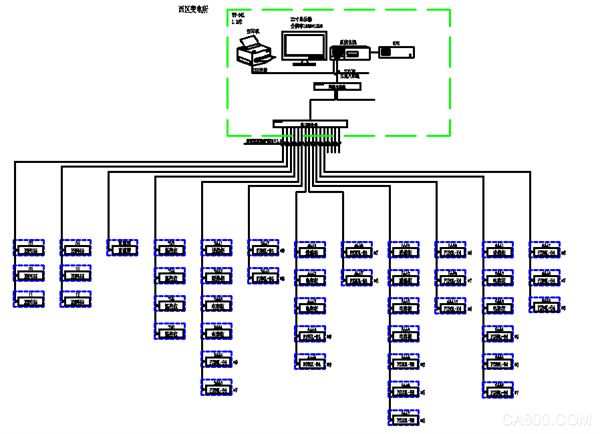
Figure (1.2) Network topology diagram of West District Substation
The interval equipment layer is mainly: multifunctional network power meter. These devices are installed in the electrical cabinet corresponding to the corresponding primary equipment respectively. These devices all use the RS485 communication interface, and realize the on-site data collection through the on-site MODBUS bus networking communication.
The network communication layer is mainly: the serial port server, its main function is to collect the scattered on-site acquisition devices in a centralized manner, and at the same time transmit it to the station control layer to complete the data exchange between the field layer and the station control layer.
Station control management layer: equipped with high-performance industrial computers, monitors, UPS power supplies, printers and other equipment. The monitoring system is installed on the computer, collects and displays the operating status of the field equipment in a centralized manner, and displays it to the user in the form of human-computer interaction.
The above network instruments all use RS485 interface and MODBUS-RTU communication protocol. RS485 adopts shielded wire transmission, generally using two wires, the wiring is simple and convenient; the communication interface is half-duplex communication, that is, both sides of the communication can receive and send data, but Only data can be sent or received at the same time, and the maximum data transfer rate is 10Mbps.
The RS485 interface is a combination of a balanced driver and a differential receiver, and the anti-noise interference capability is enhanced. Up to 30 devices can be connected to the bus, and the maximum transmission distance is 1km.
2 Main functions of the power monitoring system
2.1 Data collection and processing
Data acquisition is the basis of power distribution monitoring. Data acquisition is mainly completed by the underlying multi-function network instrument to realize local real-time display of remote data. The signals that need to be collected include: three-phase voltage U, three-phase current I, frequency Hz, power P, power factor COSφ, electrical degree Epi, operating status of remote equipment and other data.
Data processing is mainly to display the electrical parameters collected as required to users in real time and accurately, so as to meet the automation and intelligent requirements of power distribution monitoring, and store the collected data into the database for users to query.
2.2 Human-computer interaction
The system provides a simple, easy-to-use and good user interface. It adopts the full Chinese interface, CAD graphics display the primary electrical wiring diagram of the low-voltage power distribution system, displays the equipment status of the power distribution system and the corresponding real-time operating parameters, and the screen is switched periodically; the screen is dynamically refreshed in real time; analog display; switch display; continuous record display, etc.
2.3 Historical events
The historical event viewing interface mainly provides convenient and friendly human-computer interaction for users to view past fault records, signal records, operation records, and limit violation records. Through the historical event viewing platform, you can easily locate you according to your own requirements and query conditions. The historical events to be viewed provide good software support for you to grasp the running status of the entire system.
2.4 Database establishment and query
It mainly completes the timed collection of remote measurement and remote signaling, establishes a database, and generates reports on a regular basis for users to query and print.
2.5 User rights management
For users of different levels, set up different permission groups to prevent the loss of production and life caused by human misoperation, and realize the safe and reliable operation of the power distribution system. Users can log in, log out, modify passwords, add and delete operations through user management, which is convenient for users to modify accounts and permissions.
2.6 Remote report query
The main function of the report management program is to design the report style according to the needs of the user, and to filter, combine and count the data processed in the system to generate the report data required by the user. This program can also save and print report files regularly according to the needs of users. At the same time, this program also provides users with the management function of the generated report files.
The report has functions such as free setting of query time to realize daily, monthly and annual power statistics, data export and report printing.
3 Case study
The power monitoring system of Plot 07-2 in Hongqiao Business District includes the electric meter of the substation, which performs remote real-time monitoring and power management of the low-voltage distribution circuit of the substation.
The substation adopts a multi-function network power meter, which is a network power meter designed for the power monitoring needs of power systems, industrial and mining enterprises, public facilities, and smart buildings. It can measure conventional power parameters, such as: three-phase voltage, current, Active power, reactive power, power factor, frequency, active power, reactive power and other electrical parameters. This series of network power meters are mainly used in substation automation, distribution network automation, residential power monitoring, industrial automation, energy management systems and intelligent buildings and other fields.
The primary diagram of low-voltage power distribution is shown in Figure (2). The function has power telemetry and mainly monitors the electrical parameters of the operating equipment, including: line three-phase voltage, current, power, power factor, electrical energy, frequency and other electrical parameters and the three-phase distribution circuit. Phase current; the remote signaling function realizes the display of the running status of the field equipment, mainly including: the opening and closing running status of the switch and the communication fault alarm.
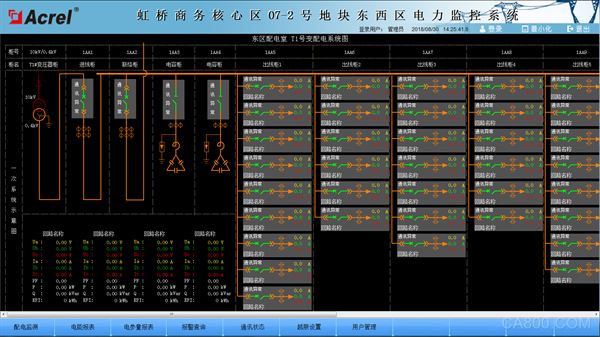
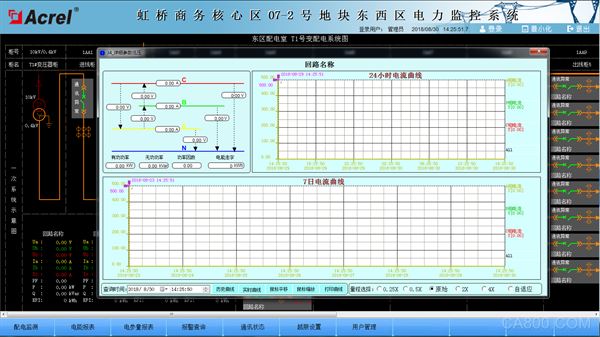
Figure (2) Primary diagram of low-voltage power distribution
The remote signaling and telemetry alarm functions mainly complete the monitoring of the switch operation status of each low-voltage outgoing circuit and the incoming load of the load, and pop up an alarm interface for the switch displacement and the load exceeding the limit, indicating the specific alarm position and sounding the alarm, reminding the duty personnel to deal with it in time. With historical query function. See Figure (3).

Figure (3) Real-time remote signaling alarm information
The parameter meter reading function is mainly used to query the incoming electrical parameters of the low-voltage outgoing circuits. Supports electrical parameter query at any time, with functions such as data export and report printing. This report queries the electrical parameters of the outlet circuit of the distribution box, mainly including: three-phase voltage, current, power factor, active power and active electrical degrees. Each loop name of this report is associated with the database, which is convenient for users to modify the loop name. See Figure (4).
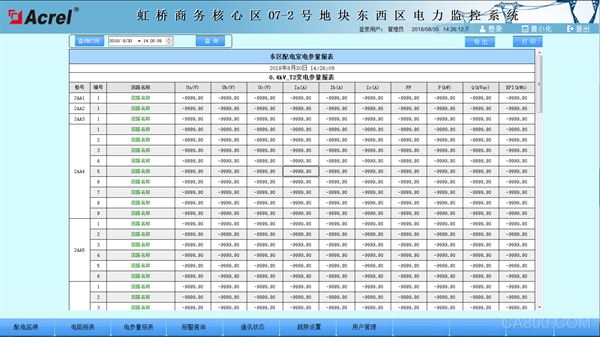
Figure (4) Parameter meter reading
Power consumption report function, you can select a time period to query, support the cumulative query of electricity in any time period, and have functions such as data export and report printing. Provides accurate and reliable electric energy reports for duty personnel. Each loop name of this report is associated with the database, which is convenient for users to modify the loop name. Users can print the report directly and save it to other locations in EXCEL format. See Figure (5).
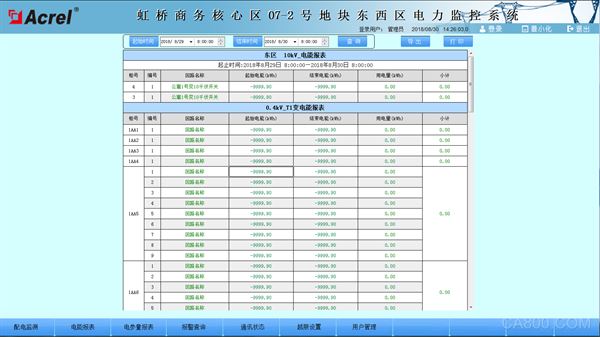
Figure (5) Electric energy report
The schematic diagram of the communication structure of the system mainly shows the network structure of the system. The system adopts a layered distributed structure and monitors the communication status of the equipment at the bay layer. Red indicates normal communication, and green indicates communication failure. See Figure (6).
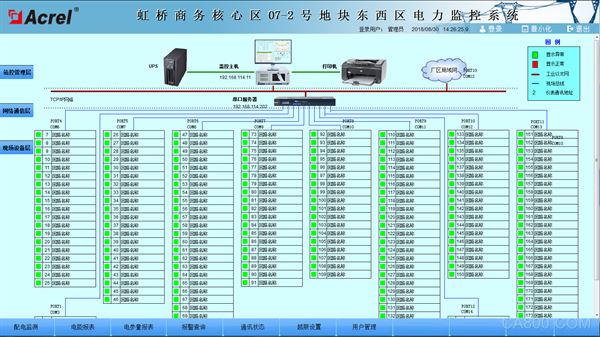
Figure (6) Schematic diagram of system communication structure
4 Conclusion
With the development of society and the wide application of electricity, the power monitoring system has become an inevitable choice for users of large-scale multi-substations such as key projects, landmark buildings/large public facilities, etc. across the country. The Acrel-2000 power monitoring system introduced in this article The application in the 07-2 plot of Hongqiao Business District can realize real-time monitoring and power monitoring of the power consumption of the low-voltage distribution circuit of the substation, not only can display the circuit power consumption status, but also has the function of network communication, which can communicate with serial server, Computers and other components form a power monitoring system. The system realizes the analysis and processing of the collected data, displays the running status of each distribution circuit in the substation in real time, has a pop-up alarm dialog box and voice prompts for the opening and closing, and the load exceeds the limit, and generates various electric energy reports, analysis curves, Graphics, etc., are convenient for remote meter reading, analysis and research of electric energy. The operation of the system is safe, reliable and stable, which provides a real and reliable basis for the users of the substation to solve the problem of electricity consumption, and achieves good social benefits. [2]
references:
[1].Ren Zhicheng Zhouzhong. Principles and Application Guide of Electric Power Measurement Digital Instruments [M]. Beijing. China Electric Power Press. 2007. 4
[2]. Edited by Zhou Zhongzhong. Product selection and solutions of smart grid user-side power monitoring and power management system [M]. Beijing. Machinery Industry Press. 2011.10
About the author: You Xiaoyun, female, undergraduate, Ankerui Electric Co., Ltd., the main research direction is smart grid power supply and distribution Email: Mobile QQ
Budget Laptop For Students is a great gift parents like to prepare for their children. There are too many choices on the market, so how to choose a right one for your children? 10.1 inch Low Budget Laptop For Students is design for kids, like below 10 years; 14.1 inch n4020 64gb Budget Friendly Laptops For Students is the most competitive and hot one for student project; 15.6 inch n5095 128gb Budget Friendly Laptops For Students is the best one for middle or high school student or teacher online teaching; Of course, also have High Quality Cheap Laptops with i3, i5, i7 10th or 11th; 15.6 inch or 16.1 inch i7 Affordable Laptop With Good Specs and dedicated graphics. Other 11.6inch celeron budget friendly laptops in 2 in 1 or yoga type also available.
Therefore, you can share your recent and powerful hardware interest, then we can recommend the right one for you. Of course, can customize as your special requirements.
In fact, the most easiest way is what you share the details, like size, cpu, ram, rom, pcs, oem service, screen, camera, etc.
Budget Laptop For Students,Low Budget Laptop For Students,Budget Friendly Laptops For Students,Affordable Laptop With Good Specs,High Quality Cheap Laptops,Budget Friendly Laptops
Henan Shuyi Electronics Co., Ltd. , https://www.shuyicustomlaptop.com